Long Squeeze, Short Squeeze, Any Squeeze Will Do.
An in depth exploration of events surrounding the CRV lending market on AAVE and its resulting bad debt
Introduction
Last month there was some chaos on Aave’s Ethereum Market; Infamous mango exploiter Avi appeared to attempt to liquidate Curve Finance founder, Michael’s, CRV collateralized position with a capitally efficient economic attack. The attack leveraged shallow liquidity and lax market parameterization, but was ultimately minimally successful on the surface.
Below will explore
brief background on protocols
what happened
where liquidators sourced liquidity
the resulting governance actions
what was highlighted by the squeeze
what new market features help address these risks
Methodology Note
Unfortunately, I was not able to include the impact of interest rates in my model at this time. Therefore, some values may be slightly inaccurate as they do not reflect interest accrued on the collateral or debt balances.
I also do not have access to centralized exchange order book data, which prevents me from confirming Avi’s off chain sales.
Brief Background
Aave
Aave is a decentralized money market which allows users to borrow and lend. Each Aave Market collectivizes collateral risk across debt assets. Lenders accept exposure to the market’s pool of collaterals and the liquidation engine without hard influence on the distribution of collateral exposed.
Aave’s v2 introduced many features related to flashloan optimizations such as collateral swaps and repaying debt with collateral. Its goal was to be a powerhouse of yield productivity and its features reflected the early yield optimizing needs of DeFi users.
They also introduced a reserve factor which allows the DAO to earn a portion of fees to pay for operational expenses, and help incentivize the safety module which helps protect against market participants via equity backing.
Liquidation Process
The V2 market measures position health via a Liquidation Threshold applied to each collateral asset. When the Loan To Value ratio (LTV) reaches the liquidation threshold, a position becomes eligible to be liquidated. While each position may have multiple collateral and debt assets, a liquidator must select a single collateral and debt asset to liquidate, and cannot liquidate more than 50% of the borrows. For more info check their FAQ.
Interest Rate Kinks
For every lent asset the ratio of supplied assets to borrowed assets form a utilization rate, and this utilization rate informs the interest charged. Interest rates reward lenders for providing liquidity to borrowers but also seek to create a balance between ability to remove supply and profits.
Due to this most markets apply a kink factor which sharply bends the curve at a certain utilization. The above curve is targeting no more than 80% utilized which would have borrowers paying ~5% and lenders earning ~4%. However once utilization breaks through 80% kink, interest rates spike encouraging borrowers to repay loans and suppliers to provide more supply until interest normalizes.
Interest accrues to total debt owed and spikes in utilization can more aggressively push a position into liquidation.
In the case of CRV the utilization kink was set to 45% utilization.
Curve
CRV is the governance token of Curve Finance which is an Automated Market Maker which specializes in bonding curve manipulation. Most CRV liquidity is hosted on Curve Finance.
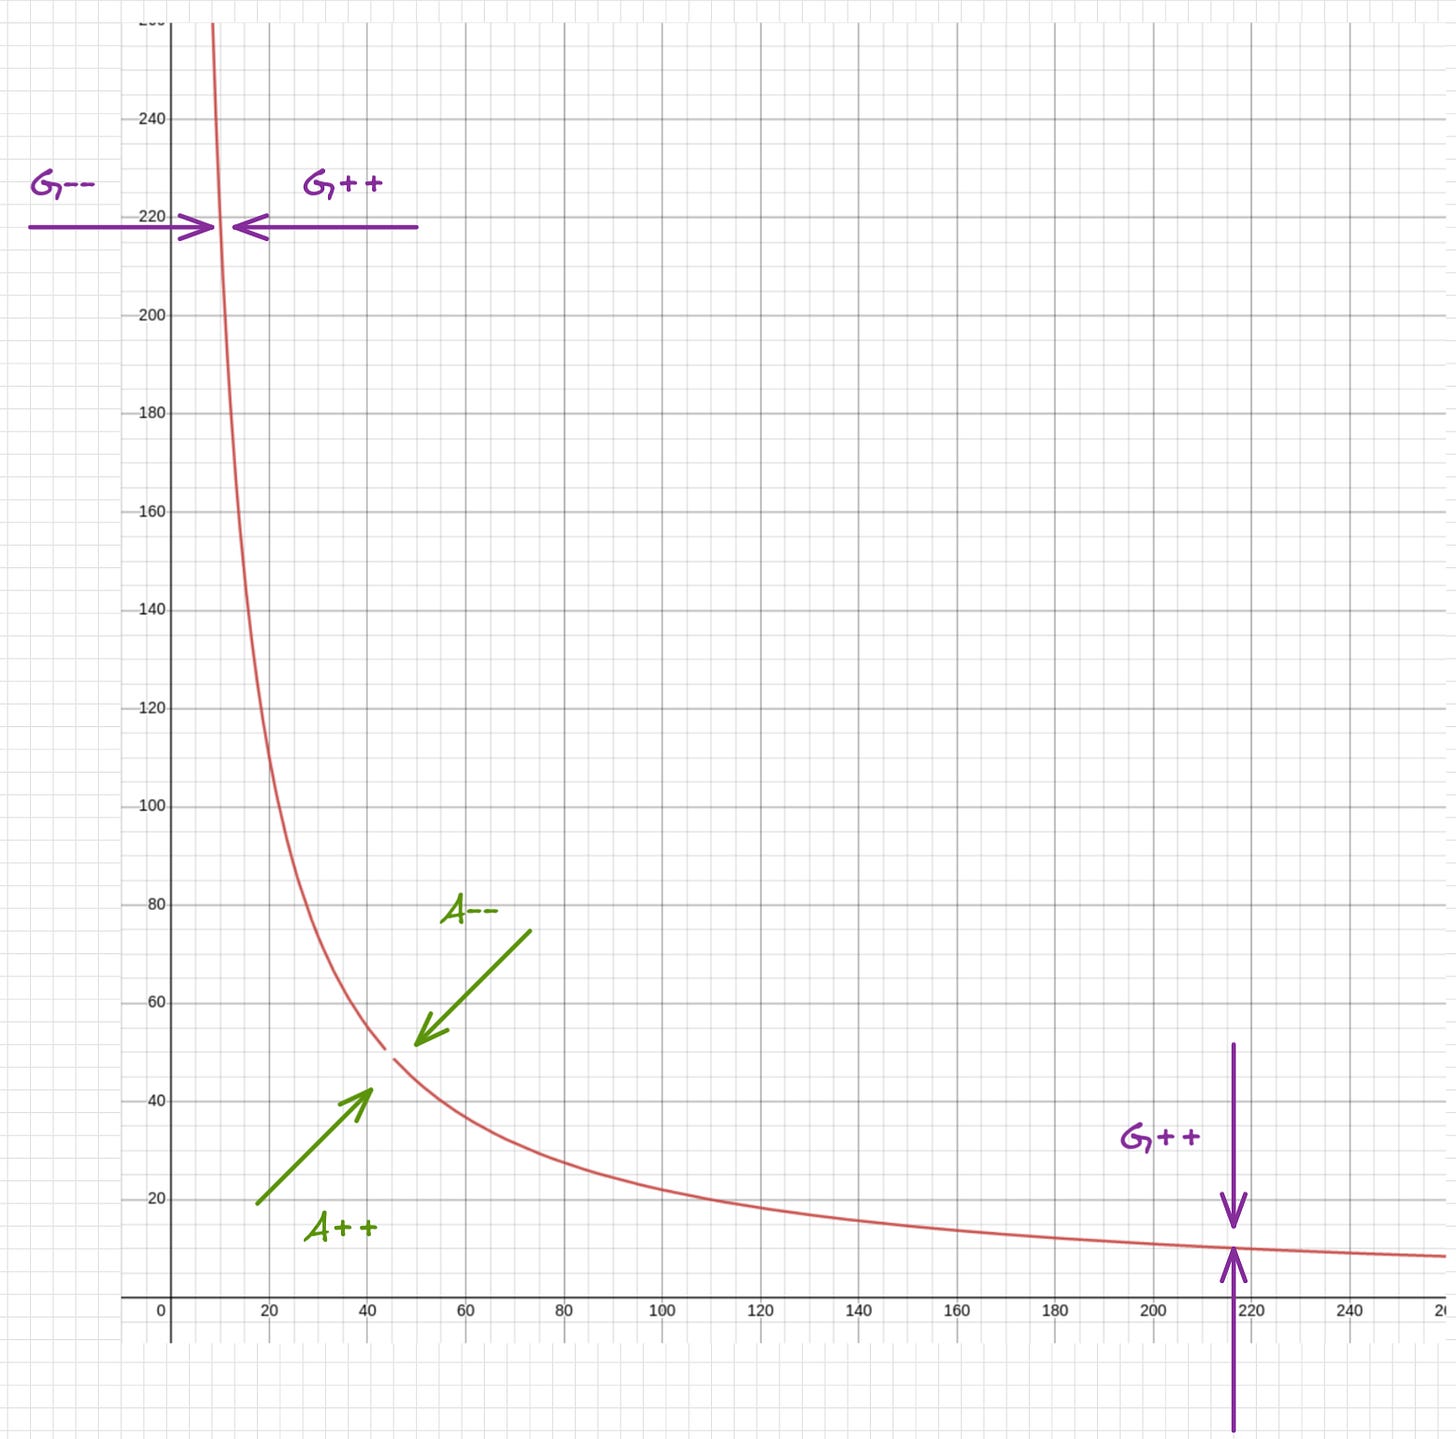
V1 introduced the Amplification Coefficient (A) which influenced the middle of the bonding curve which allowed flattening for like peg swaps.
V2 introduced Gamma (G) which influences the far ends of the bonding curve. This can counter the impact of A allowing for less liquidity to be reserved for the infinite ends.
However, this deeper liquidity isn’t just stagnant awaiting “toxic flow”. V2 introduced price scaling which allows the pool to repeg based on an exponential moving average oracle input.
This means that as offchain market movements occur, Curve V2 actively reprices liquidity rather than passively waiting for an arbitrager to capture profit from the pool in order to reprice.
Additionally, Curve utilizes timelocks for governance, and has a robust set of governance derivatives competitively removing CRV from circulation.
What happened
The attack can be described in five main phases.
Michael’s setup. Where Michael’s movements in reaction to price trigger Avi’s interest
Avi’s setup. Where Avi begins to establish his positioning
Avi’s Attack. Where Avi appears to try to trigger a liquidation
Avi Gets Liquidated (2 Parts)
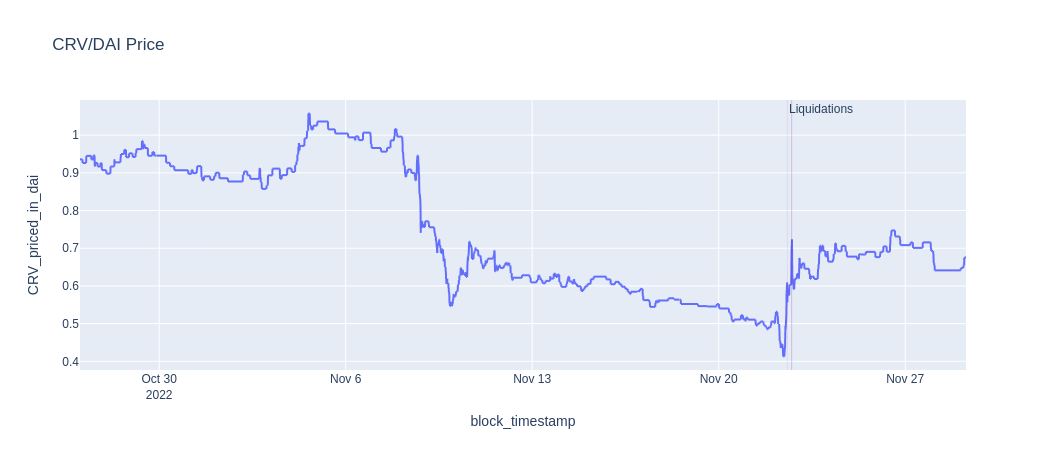
We can see in the chart above that the attack triggered a large increase in volume over 6 times that of the sudden price crash earlier in the month and over 15 times the max volume of the prior five months.
The thought here is that if Avi can liquidate Michael, the sell pressure would be massive relative to available liquidity such that liquidating Michael’s position risks bad debt for AAVE, and a monumental collapse in price for CRV.
This would enable Avi to cover his debt at a great profit.
Likewise if Avi achieves a large debt position with a high liquidation threshold, if liquidated the buy pressure would be massive relative to liquidity such that it risks bad debt for AAVE and the price of CRV could skyrocket.
1. Michael went long with size
Michael has a substantial amount of CRV. In order to access its purchasing power while remaining long, he began more aggressively borrowing against CRV in late March 22, driving up his total CRV collateral to 128.5M by earl July.
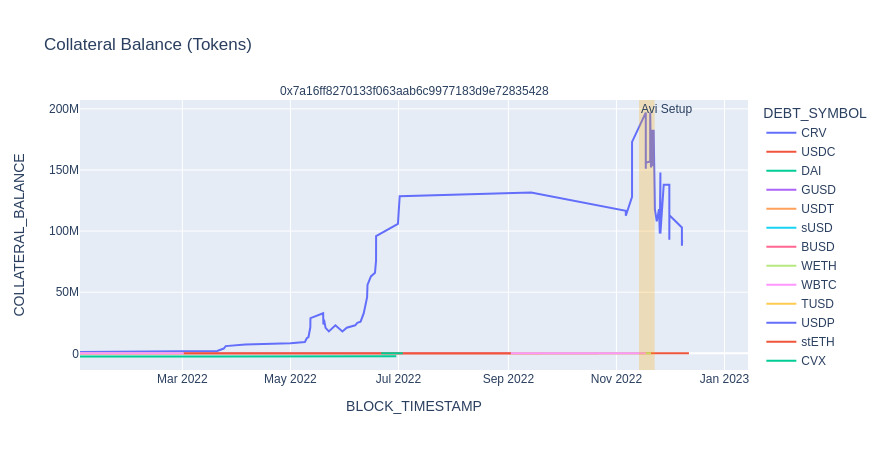
In early November Michael ramps up that balance from ~132M to 172M (+30%) during a window where the price of CRV falls from ~$1 to ~$0.55. This appears to have caught Avi’s interest.
While this position holds about 10% of the total issued supply, this amounts to about 30% of the total circulating supply after various locked governance derivatives are accounted for. At the time Avi makes his first deposit (November 13th), the CRV lending pool is about 34% utilized with Michael’s collateral making up a whopping ~93% of the supply available to be borrowed on Aave.
I will be using the above format going forward to summarize position changes for each period. It can be interpreted as follows
The Start and End sections correlate to the first and last block of the corresponding highlighted sections in other graphs.
The Red Area represents debt value (USD)
The Grey Area represents collateral value (USD)
The Red Vertical Line represents the liquidation threshold of the position
The Black Line represents the net value of the position (collateral - debt)
The Large Value on the right represents net value as well
The Green Indicator on the right represents how much more debt can be drawn
2. Avi sets up for a feast

Avi
Avi takes his time. Starting on November 13th, he begins by depositing a sum of ~$39M USDC then borrowing small sums of CRV until he acquires a debt balance of ~17M tokens. During this period Avi never deposits additional collateral. To me this signals that he was trying to build up a CRV short position without drawing attention.
USDC has a liquidation threshold of 88% and a max loan to value of 86%. In this phase he only draws a minimal amount of debt to achieve a 23% LTV leaving room to borrow just under another 4x.
During this window Avi transfers 68% of CRV transferred to the centralized exchange OKX via an EOA proxy address. The remainder appears to be traded using MEV bots, and mostly 1inch.

Michael
During this phase Michael also makes several adjustments to his position, though the downward price pressure moves his Loan To Value ratio from 32% to a high of 46%. Without much direct pressure from Avi, he finds himself in a more precarious position.
CRV has a liquidation threshold of 65%. His buffer reduced by 1/3, but still reasonably safe.
3. Avi Attacks
Avi
Its not until the morning of November 22nd that things begin to ramp up. We see Avi borrowing another 20M CRV, with a prior hourly volume of ~1.04M tokens, now ready to make his move. He needs to drive the price of CRV down another ~48% from $0.52 at the start of the attack to $0.27 where Michael’s liquidation threshold lies.
We see a sharp price decline before he deposits more collateral and extends his debt.
Right around 11:00, with CRV at $0.42 Avi completes another series of borrows totaling 50M CRV worth about 21M.
During this phase Avi sends 75% of his CRV to OKX via an EOA proxy. The remainder is sent out via 1Inch, MEV bots and Uniswap and Sushiswap directly.

At this point Avi controls roughly ~64% of the total CRV debt on AAVE with the pool ~70% utilized. With minimal liquidity available to continue borrowing, and mounting volume to combat his directional price drive, Avi seems to accept fate. The downward pressure ceases and its up only until the first liquidation hits.
Michael
To his part Michael repays some debt during the attack, but switches gears as price rises. Prior to each liquidation, he withdraws CRV bringing his tokens on AAVE to a low of ~118M. This demonstrates he was active during the attack was available to defend his position if necessary.
Reducing his CRV position acted to prevent Avi from borrowing more and potentially restarting the attack, but also prevented liquidators from accessing that capital.
We’ll look more into the impact of these withdrawals on utilization below in the liquidation sections.
The Curve team also drops the Llamma white paper just prior to his withdraw before liquidation 1 during a dip in volume. Absolutely incredible timing.
4. Avi Gets Liquidated

The liquidation is split into two parts with about 9.5% liquidated in the first liquidation and 97% of the remainder liquidated in the second about 4 hours later. The second liquidation was far more active.
The price drops after the first liquidation and stays oddly flat until the second liquidation arrives. What I would do to be a fly on the wall in a war room of liquidators those few hours is unbounded.
Liquidation 1:
The first liquidation is dominated by address 0x80d4, taking 60% of the total ~8M CRV liquidated.
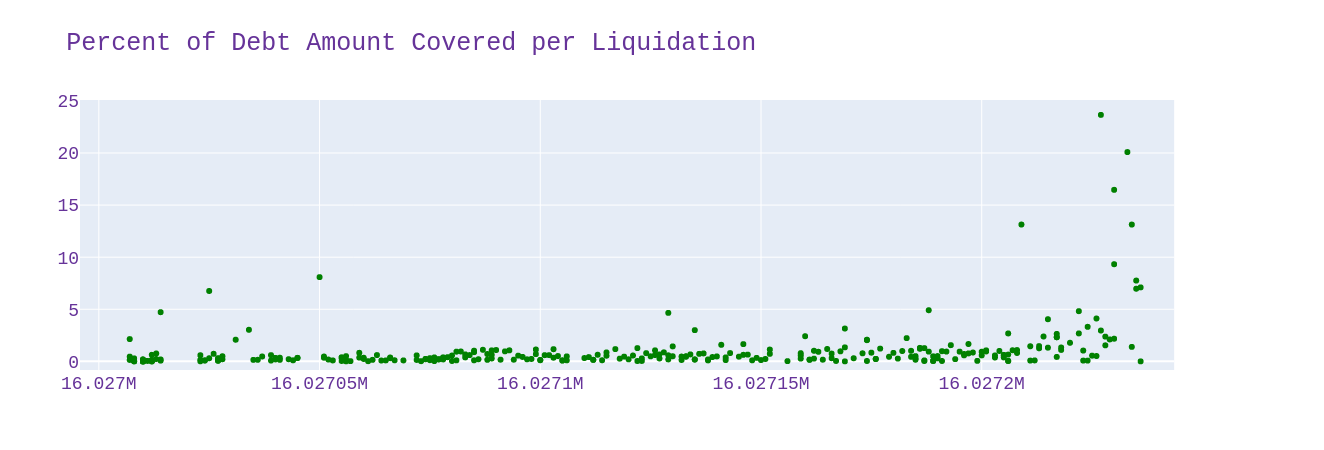
While liquidators can liquidate as much as 50% of the debt, most liquidations in this first wave target less than 0.6%. I interpret this as there was not yet confidence in available liquidity.
Liquidators will not act unless the opportunity is profitable. It appears for the first liquidation that liquidators resisted taking significant bites from the position. Spread out small liquidations can make gas costs more impactful in profit calculations.


Michael makes a large CRV withdraw pushing the CRV utilization from 68% to 92% within 30 minutes of liquidation. This limits how much new borrows can lean into CRV debt, but also spikes interest which nudges Avi toward liquidation in addition to price pressure.
Liquidation 2:
The second liquidation is again dominated by address 0x80d4, though taking a smaller 34% share of the 78M CRV liquidated this round.
While many liquidation events still prefer smaller sized bites, there are a few larger chunks taken early in the liquidation process. To me this signals the liquidators were more prepared to act during this window. We see this liquidation drives the collateral down to 0, and therefore when the tail end of liquidations take larger sized bites, this is measured against a much smaller debt amount than the start.


One thing I find quite interesting about the above utilization chart is the divergence between Avi’s debt decreasing and the total CRV debt decreasing. The later reduces by far less than the former, demonstrating strong borrowing demand from other market participants.
Avi’s debt falls from 78M to 2.5M while the total CRV borrowed drops from 128.7M to 95.3M. That means 42.1M in new borrows occurred during the second liquidation.
Michael again withdraws CRV a little under an hour before liquidations began which pushed utilization from ~80% to ~89% utilization. Again limiting liquidity available to borrowers and accelerating the nudge of interest towards Avi’s liquidation point.
While Avi’s collateral has depleted to 0 USDC, his debt has depleted to ~2.5M CRV, a roughly $1.4M dollar value at the time.
Notable Liquidator Activity
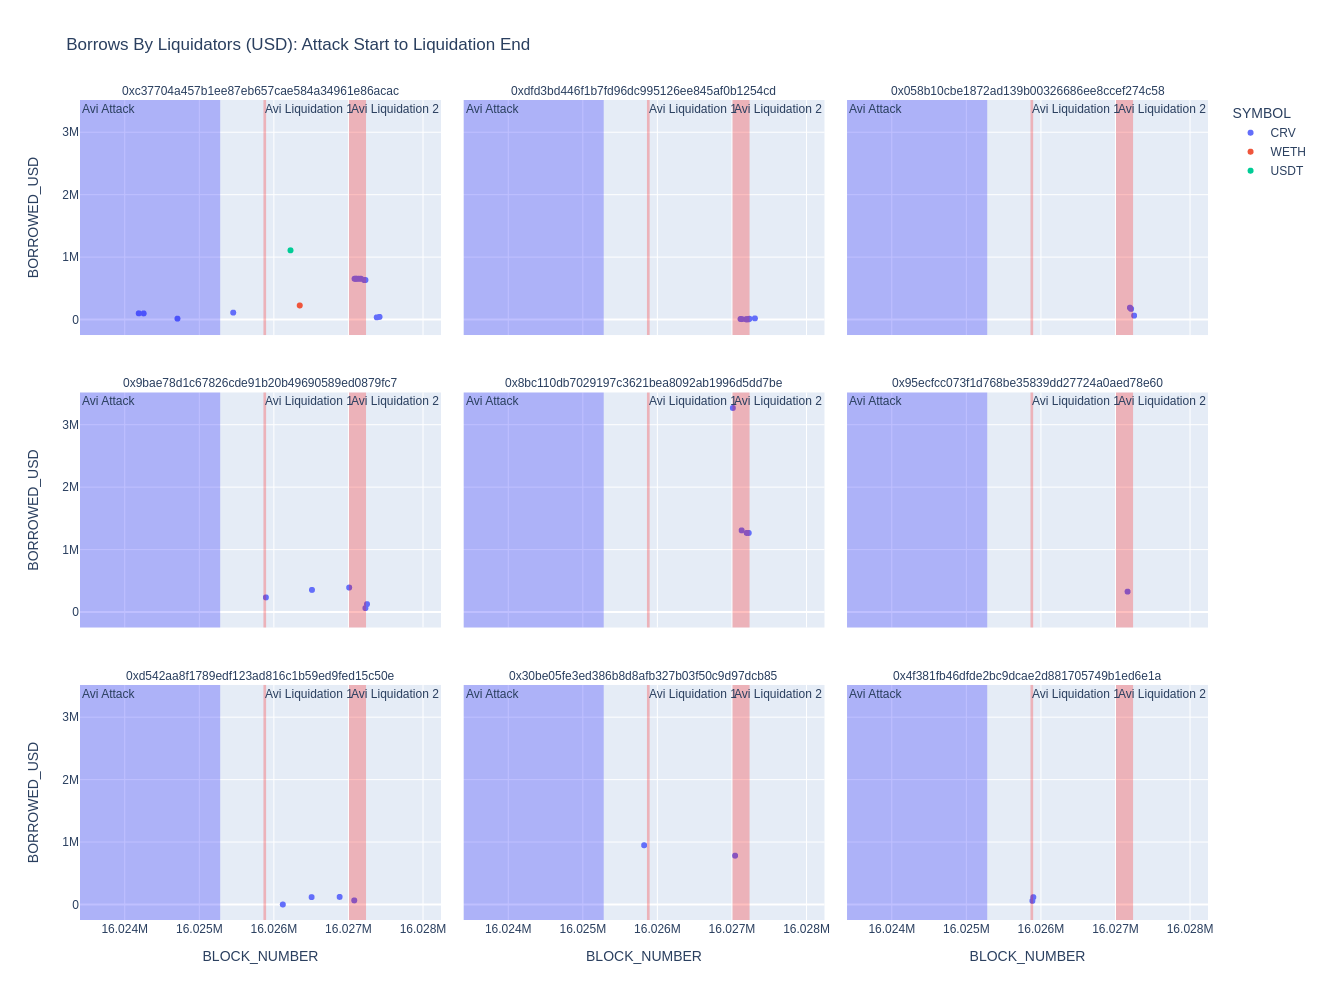
A total of ~27M CRV were borrowed by liquidators from the start of the attack to the end of the last liquidation on AAVE.
Many of these borrows occurring during the liquidation windows themselves
Two Liquidators sourced liquidity from withdrawing their own CRV deposits totaling 6.2M.
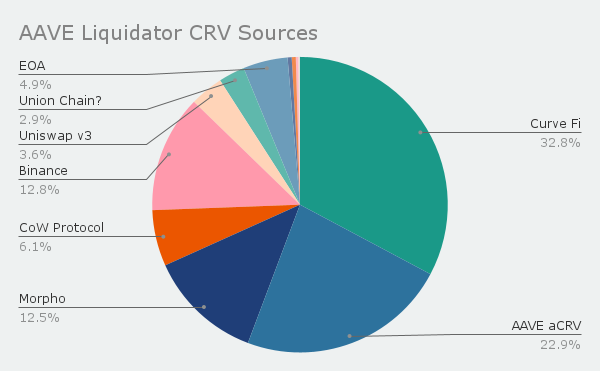
From the start of the attack to the end of the last liquidation, ~124M CRV was transferred to liquidators, of which 89.5M was used for liquidations.
Its neat to see 12.5% of CRV sourced to liquidators via Morpho (15.5M), a P2P lending platform. Combined with AAVE withdraws/borrows debt platforms contributed ~35% of on hand liquidity to liquidating parties. This could have potentially covered up to 47% of the total liquidated CRV. That’s frankly incredible, and is a neat example of how individuals can privatize price divergence risk for protocols. Instead of liquidation needing to happen now, it can happen later on these second order loans.
Thankfully passing the risk buck down the line didn’t result in a delayed third massive liquidation event… at least for now.
Morpho Exploration
I’m finding the data around Morpho to be weird. While the address has a debt balance, I am only seeing repayments and withdraws but no deposits or borrows. I believe the deposits are mostly from users transferring aCRV to the Morpho-Aave contract, but I feel there is some credit delegation happening which is impacting my view of borrow events. At present have not found a satisfactory dashboard covering their overall activity.

Morpho repaid 4.5M of CRV debt and withdrew 13.5M of CRV collateral from Aave.

5.16M aCRV was transferred from Morpho just prior to the liquidation and 5.14M aCRV were transferred to Morpho just after. While 3.9M and 4.2M borrows occur just at the start of the second. The amount of deposits into Morpho prior to each liquidation event appear to ramp up, supplying liquidity to liquidators.

While I’m not satisfied yet with my view of Morpho’s debt movement, we can see that activity picked up shortly after the attack phase began when the kink started causing the interest rates to appreciate faster.
Resulting Governance Actions
In reaction to the above events, AAVE governance has taken upon itself to make a slew of changes:
AIP121 Risk Parameter Updates for Aave V2 ETH Market (2022-11-22)
This froze many collateral assets, preventing new deposits or debt from being drawn. Thankfully vacationing borrowers, this did not impact the collateral power of assets already deposited.
AIP122 Pause LINK Borrowing
Rather than freezing LINK, the ability to borrow it was frozen, allowing deposits to continue, but preventing new borrows.
AIP123 Pause UNI Borrowing
Rather than freezing LINK, the ability to borrow it was frozen, allowing deposits to continue, but preventing new borrows.
AIP124 Risk Parameter Updates AAVE v2 Polygon
This froze many assets on the AAVE v2 market deployed on Polygon inline with AIP121
AIP129 Freeze AAVE v1 (Failed)
While this proposal did not pass, it was an interesting gut reaction from governance.
What was highlighted by the squeeze?
Mismatched market parameters
As stated at the start of the article, AAVE v2 was tailored to optimize costs of operation. Many design influences originated from flashloans and gas optimizations for acting within a market. This desire to maximize efficiency lends itself to centralization risk.
One under explored security minded feature of the v2 system was AAVE Markets. This enabled the DAO to spin up multiple money markets which could segment risk and allow more tailored parameterizations.
In theory, there is different types of money market activity, and these could be reflected by distinct risk parameters for the same assets per market. For example, it would be appropriate for USDC as collateral for an ETH loan to have a lower maximum Loan to Value (LTV) ratio than USDC as collateral for a DAI loan because there is a higher risk of volatility led insolvency in the former.
In practice most Aave Markets are simply chain specific risk segmentation, and an Institution segmented market (AAVE ARC).
There is one collateral specific risk segmented market, the AAVE AMM Market. This market is largely underutilized as its timing lined up with high demand for staked LP’s, and new AMM upgrades which were not supported.
This aversion to multiple markets has led to the conversion of risk parameterization for different use cases in a single market, and in my opinion resulted in max LTV settings for stablecoins which favored like peg loans, putting cross peg loans at greater collateral risk.
Here USDC had an 88% liquidation threshold.
Parallels with Rari Capital
While AAVE has not expanded deeply into multiple market potentials, we had a brief window into what that would be like with Rari Capital; which allowed permissionless creation of money markets with specific collateral and lending assets per market.
While incredibly powerful in theory, it had major friction around matching supply to demand across pools. Ultra low liquidity makes it hard to asses benefits of arbitraging rates, being unable to share collateral across various markets increased the risk to managing multi market positions. It was often referred to as the Chicken and the Egg problem.
This pressure was a primary drive for Rari’s focus on yield bouncing vaults, but these become cumbersome to manage risk appropriately for new permissionless pools. Rari shut down before such yield bouncers were active beyond a handful of assets and pools supported, but it lives in memory as an example of the difficulty in using segmented markets to manage risk.
Many competing mega-pools ended up forming which greatly crowded risk assets to try to lure in lending capital, but these just echoed the conversion of risk parameters shown here with Aave.
Pricing changes
For the attack through the liquidation
Low Price: $0.4123 High Price: $0.7239 Increase: 75%
For the first liquidation
Low Price: $0.6004 High Price: $0.6090 Increase: 1.4%
For the second liquidation
Low Price: $ 0.6028 High Price $0.7239 Increase 23%
The most important increases to pay attention to are those which occur during liquidations. We previously saw that the second liquidation caused the bad debt. The price increased by 23%. USDC has a liquidation threshold of 88% and a liquidation bonus of 5% to incentivize liquidators.
That’s a 12% price difference between where a liquidation can start and when a position is undercollateralized. With the incentives in the mix, only a 7% price difference before the protocol faces bad debt.
While volatile collateral have an average liquidation thresholds < 71%, ETH has a liquidation threshold of 85%, which is pretty close to USDC despite being volatile. Had the collateral been ETH, we likely would have seen very similar outcomes. Despite stronger correlation, the main market pair for CRV is with ETH so CRV demand puts downward pressure on ETH whereas USDC is less impacted by CRV demand.
Mismatched size vs market liquidity
The total CRV collateral is about 33 times the daily volume leading up to the attack (~ 169 / 5). This appears to be too much. ¯\_ (ツ)_/¯
The total CRV debt is about 28 times the daily volume leading up to the attack (~ 144 / 5). This appears to be too much. ¯\_ (ツ)_/¯

Where is the line between just right and too much? While these numbers appear very large, ultimately the system processed through with only 2.7% of the liquidated position in bad debt w/ only thin margin from the 88% liquidation threshold before penalties are applied. Would simply better market parameters on collateral have provided enough of a value buffer between collateral and debt to complete the liquidation without a hitch? Hard to say, but I feel the relative size certainly contributed to the stress.
Finding a balance in capping use relative to market liquidity is no easy governance task as liquidity frequently changes and its a difficult limit to reduce given the lack of communication channels between systems and their participants.
Protocols are still working out ways to formalize non emergency ways to ramp down total collateral and debt of certain assets if they begin to pose a risk. Disallowing new positions from being taken doesn't reduce existing risk and while there are cases where that can be applied, it acts to cap the problem rather than reduce it.
As a historical example, Compound famously increased c-ratio of wBTC and quickly it grew into a dangerous level of assets forcing them to reduce the c-ratio and had some parties not acted they would have been liquidated. See linked forum discussion as well.
Competition for borrow utilization
Liquidators needed CRV liquidity, preferably without too much price appreciation. Borrowing is the perfect way to achieve this, especially if you speculate the upward price trajectory is due to the liquidation itself, and will correct afterwards. Unfortunately for liquidators, the broader market wants in on this action too.
We saw 35% of CRV sourced by liquidators came from loans. We also see that Avi has occupied ~70% of Aave’s CRV utilization by the the start of the first liquidation of his attack, yet the pool was 80% utilized by the time he was fully liquidated. This shows that there was a massive appetite for borrowing CRV during this liquidation beyond that of liquidators.
1/3 of liquidators borrowed CRV came through Morpho which uses P2P loans to match borrowers and lenders at a rate between the supply rate and borrow rate. After utilization passes through the kink (45% for CRV), interest rates increase quicker, which maintains large spreads between supply rate and borrow rate, and make Morpho quite useful to minimize the impact of interest on bottom lines, especially if positions must remain open for a longer period before they can be closed.
Liquidation Engine Performance
Splitting the liquidation into many small bites helped distribute the liquidation across a broader period of time which enabled more arbitrage to occur and suppress the impact of the liquidation on the total bad debt.
However more liquidations cost more gas, and reduce the profit opportunity to liquidators. The 50% cap can be limiting in completely closing the tail end of debt.
In this event the 50% cap was not approached with the largest tail end liquidations still only impacting <25% of the position.
While there is risk present, I feel that AAVE v2’s liquidation engine performed quite impressively and allowed an incredibly significant amount of CRV to be offloaded with only 2.7% converting from collateralized to bad debt.
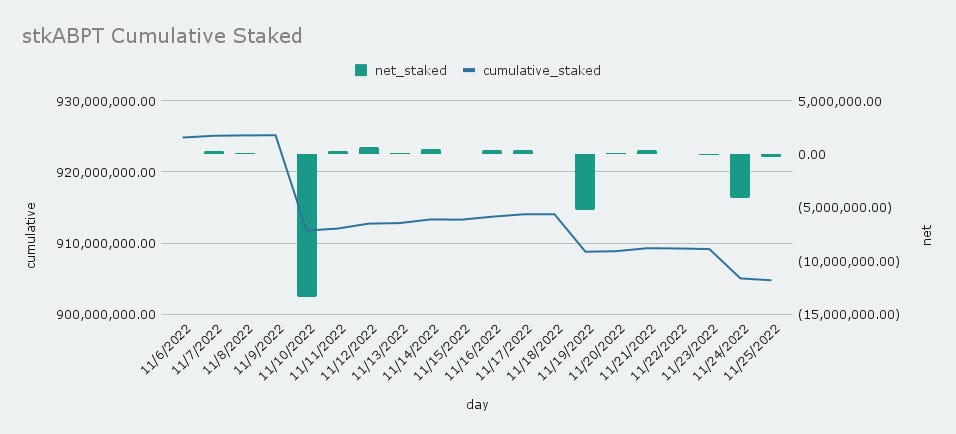
Safety Module Withdraws
A portion of interest collected for the reserve factor which goes into the ecosystem fund. This fund is used to incentivize the safety module which acts as a backstop for the protocol.
However one issue with the safety module is that governance must vote on paying out bad debt from the safety module and that faces a certain amount of time. With the setup starting on the 13th, and the attack occurring on the 22nd, we see that stakers may have time to recognize an attack and have adequate time to start the cooldown process. While there is a cooldown, attacks can be spread out with time to frontrun the governance vote taking effect.
It seems in this case, there was no significant exit activity which occurred in the setup of the attack and most exits stem from the stkAAVE pool totaling nearly 800k stkAAVE, which makes up a significant amount of the 3.2M stkAAVE prior.
Cooldown periods perhaps could be extended, or establish alternative routes of short term cooldown extensions which can be triggered by governance when an attack is recognized.
While significant debt was not achieved this round, the delay between the time for governance action to take place vs the cooldown poses a race condition that may pose a risk in the future, and should potentially be adjusted.
Curve Repricing
While I have not had the time to fully explore this, it seems interesting that Avi directed all his sell pressure to OKX. Given that most CRV liquidity is on Curve Finance and Curve reprices based on oracle information, its possible that he was trying to drive the price of CRV further down by influencing repricing of the primary liquidity market.
In theory, as Curve reprices liquidity it reduces the buy/sell wall of liquidity to burn through to move a price in any particular direction. This is good for LPs, as it reduces the impact of divergent loss on volatile pairs (a.k.a. impermanent loss), but makes it harder to assess risk based on that liquidity, and those governing lending market parameters should develop ways of assessing liquidity.
Though I should note that Curve’s programmatic changes in liquidity are more reliable in action than arbitrary V3 management.
Notably DeFi Llama put up a new dashboard in reaction to this event which allows risk teams to check depth in real time, but so far demand has been lax and they are not seeing the demand to justify maintaining a historic record. I think this might be an area where demand for such a service is rarer and may be best justified as a grant from lending protocols to record this history for less frequent risk events and risk analysis where it becomes very useful for governors.
New market features help address these risks
Efficiency Mode
Aave V3 vaults have the ability to recognize when they service highly correlated assets to access higher borrowing power. This helps address mismatches in market parameters by allowing vaults to enter a distinct mode based on their debt, rather than participate in an entirely separate market.
I think this is a very powerful feature that helps mitigate liquidity fragmentation in a pooled fashion while providing more individually catered liquidation thresholds.
Isolation Mode and Siloed Borrowing
Aave V3 can list assets in isolation mode or siloed borrowing. The former limits an asset from being used as collateral with other assets, and the later prevents users from borrowing an assets at the same time as other assets.
While not particularly impactful in the above example with dominate single asset collateral and debt, its a useful new tool in curtailing risk derived from particular market pairs.
Supply and Borrow Caps
These caps regulate how much of an asset can be supplied or borrowed, and can be used to help reduce the risk of mismatched size vs market liquidity. By default these caps are set to no cap, so their effectiveness depends on strong governance and quick action in times of risk.
These limits at present do not appear to have any kind of utilization limitations which mean that they can be filled up by few participants without pressure to open access. This may create pressure from users to increase caps. I’m very keen to follow how governance around these dials will play out, as I believe we will see some controversy on this front due to the potential for unbalanced access.
There’s also friction around reducing these caps in that they may impact existing positions.
Granular Borrowing Power Control
This feature allows borrowing power to be reduced for assets without impacting existing borrowers. This could be used to cut off CRV borrowing during the set up phase, maybe encouraging faster attack attempts, and is generally quite the handy tool.
However since this doesn’t impact existing debt it can only be used to stop a problem from growing but not to reduce existing threats.
Price Oracle Sentinel
This feature would allow a grace period for liquidations and disables borrowing under certain circumstances. In many ways this acts similar to Compound’s Absorption model. By adding a grace period, the protocol takes on the debt risk for the duration of the grace period. This is a path dependent risk which could allow time for markets to settle rather than definitively selling collateral at a loss vs debt, but may also find the value of the debt has increased an even greater degree vs the collateral.
It is extremely important for this to be well governed as this is the biggest point of risk to Aave Stakers. Much like the recent FTX drama demonstrated with Alameda being exempt from liquidations, having a party which is immune to liquidation risk can allow that party to accumulate significant unbacked debt and can kill an otherwise working system.
While it can be very effective in dealing with most threats more profitably, it opens the door for larger failures.
Absorbtion
Compound Finance v3 has an alternative more explicit approach to the Sentinel where all liquidations are absorbed by the protocol and the protocol automatically pays out reserves before auctioning the collateral to replenish its reserves.
This set up is quite interesting as it formalizes features like the safety module bypassing governance and cooldown times to act directly with collectively owned assets rather than equity.
In many ways this makes the protocol a borrower during liquidation and may help reduce competition among liquidators for borrow utilization as it centralizes that battle unto itself.
Liquidators can then buy collateral at a discount using the debt if the protocols reserves of the debt are less than a target amount. This acts to extend the duration of auctioning collateral to the market and treats liquidators more like keepers balancing Compound’s reserves rather than any particular positions.
This feature feels both incredibly fascinating and potentially dangerous to me as it opens up a lot of risk to Compound. Despite my hesitation I see the formalization of this to be extremely innovative and potentially having rippling effects towards how more generalized collective ownership of pooled assets are managed.
Concluding Thoughts
We’ve now seen the dangers of market based risk management, and uncapped access to lent capital. While we’ve seen many attacks like this in the past, the way in which this event was unsuccessful made it far more interesting, covering a long squeeze, then a short squeeze, then an organized short to combat the short squeeze and protocol pooled capital.
As always with liquidation risk, the risk is not in price change but speed of price changes. Often liquidations risk amplifying the speed of price changes by contributing to the momentum, selling into mass existing sell pressure and buying into massive buy pressure.
In this event we saw how distributing liquidations across time spread among many events helped reduce the impact on volatility. We can also see speed addressed in new features like Sentinel and Absorption approaches by new markets, and this certainly gives me as an observer a thirst to see them tested. Seeing how large a part debt played in liquidations makes me feel that formalizing these processes collectively is an important step forward.
We saw risk presented in relative market size but a lot remains to be seen as to the best way to curtail this. Are more conservative liquidation thresholds enough? Are supply and borrow caps useful in supporting higher liquidation thresholds? How effectively will these caps adapt to changes in supply or market liquidity? This area has the most open questions in my mind as its strongly bound to active governance action. I’m certain these points will be extremely common in discussions across lending markets in the new era.
We saw the issues of mixing market targeted parameters for risk across use cases and the friction between larger liquidity pooled and risk management. With new features like efficiency mode, silos, and isolation vaults we can expect to see far more nuance in how collective pools of liquidity can apply more tailored parameters for individual components.
Overall, given all that occurred and a backdrop of CeFi lending failures, I think 2.7% of debt going bad is a success, and demonstrates the soundness of decentralized lending markets. While I certainly expect continued escalation of attack vectors and defensive structures, this hardening is good for our ecosystem and helps validate the effort put in by all contributors so far. We have a lot of work ahead of us in DeFi, but we appear to be on the right track.
Hats off to 0x80d4230c0a68fc59cb264329d3a717fcaa472a13 and the rest of the liquidator crew for ensuring bad debt remained minimal.


